
QMSys_NQ1
Intraday system to trade the future of the Nasdaq. It operates in bars of 30 minutes. It operates in the session from 8:30 a.m. to 3:00 p.m. Non-sample period from April 2021.
It is a system built by our Genetic Builder, through a robust methodology, based on different phases of development in order to be able to choose the most robust systems in non-sample periods (for more information you can contact us through the email address of our website).
You can spread your contracts across all these variants (recommended), but a maximum of 4 micro/Emini is allowed across the entire QM Sys1.x NQ system pool.
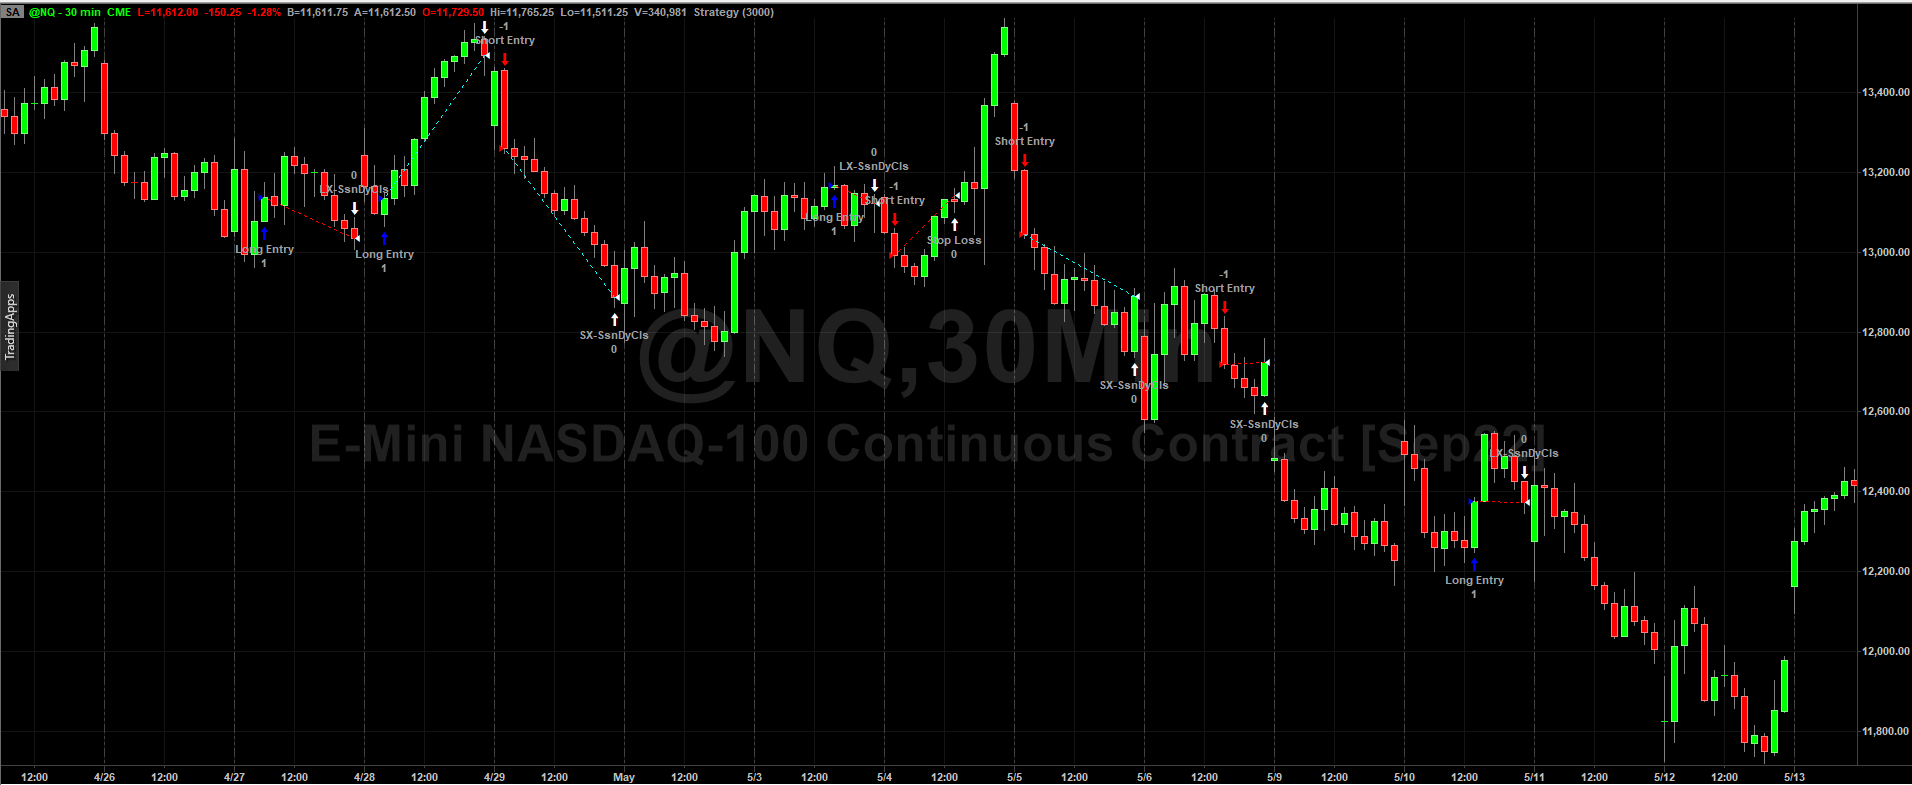
Operations chart
Intraday system
Trades the future of the Nasdaq
Operable symbol
NQ
Timeframe
30 minute bars
Daily session
From 8:30 a.m. to 3:00 p.m.
Out-of-sample period
From 04/2021
Price
699 €
Backtest Metrics
Performance Summary
In this report you can find the backtest metrics of this intraday trading strategy: QMSys_NQ1
| Total Net Profit: | $166,375.00 | Max Drawdown: | ($9,535.00) | |||
| Gross Profit: | $308,310.00 | As % of Initial Equity: | 25.00% | |||
| Gross Loss: | ($141,935.00) | As % of Total Equity: | 4.66% | |||
| Profit Factor: | 2.172 | Max Drawdown Date: | 10/7/2021 | |||
| Pessimistic RR: | 1.873 | Max Intraday Drawdown: | ($11,470.00) | |||
| Open Position P/L | $0.00 | As % of Initial Equity: | 30.07% | |||
| Total Trades: | 375 | As % of Total Equity: | 5.61% | |||
| Winning Trades: | 227 | Max Intraday Drawdown Date: | 10/12/2021 | |||
| Losing Trades: | 147 | Longest Drawdown: | 618 days | |||
| Even Trades: | 1 | Recovery Factor: | 17.45 | |||
| % Profitable: | 60.53% | NP/MaxDD | 17.45 | |||
| NP/Intraday MaxDD | 14.51 | |||||
| Max Runup: | $167,210.00 | |||||
| Avg. Trade Net Profit: | $443.67 | As % of Initial Equity: | 438.41% | |||
| Avg. Winning Trade: | $1,358.19 | As % of Total Equity: | 81.76% | |||
| Avg. Losing Trade: | ($965.54) | Max Runup Date: | 4/14/2022 | |||
| Ratio Ave Win:Ave Loss: | 1.407 | Longest Runup: | 4346 days | |||
| Largest Win: | $11,145.00, 3.61% | Initial Capital: | $38,140.00 | |||
| Largest Loss: | ($3,025.00), -2.13% | Margin Requirements: | $4,000.00 | |||
| Max Cons. Winners: | 15 | Return on Initial Capital: | 436.22% | |||
| Max Cons. Losers: | 6 | Annual Rate of Return: | 36.51% | |||
| Avg. Monthly Return: | $1,160.42, 3.04% | |||||
| Trading Period: | 4361 | Std. Deviation of Monthly Return: | $4,608.69 | |||
| 5/7/2010 – 4/14/2022 | % Profitable Months: | 64.52% | ||||
| Total Trading Days: | 370 | |||||
| Longest Flat Period: | 166 days | Sharpe Ratio: | 0.397 | |||
| Max Futures Contracts: | 1 | Sortino Ratio: | 0.835 | |||
| Max Forex Contracts: | 0 | Sterling Ratio: | 0.077 | |||
| Max Shares: | 0 | MAR Ratio: | 1.342 | |||
| Total Systems: | 1 | Efficiency Factor: | 0.540 | |||
| Total Commission: | $1,875.00 | |||||
| Total Slippage: | $7,500.00 |
Periodic Returns – Annual
In this table you can see the annual results that this intraday trading strategy has been achieving: QMSys_NQ1
| Period | Net Profit | Return on IE | Return on TE | # Trades | Profit Factor | % Profitable |
| 2022 | $32,715.00 | 85.78% | 19.04% | 30 | 2.31 | 66.67% |
| 2021 | $17,740.00 | 46.51% | 11.51% | 51 | 1.48 | 54.90% |
| 2020 | $61,665.00 | 161.68% | 66.74% | 42 | 3.60 | 71.43% |
| 2019 | $455.00 | 1.19% | 0.49% | 31 | 1.04 | 51.61% |
| 2018 | $22,960.00 | 60.20% | 33.29% | 45 | 2.16 | 60.00% |
| 2017 | $500.00 | 1.31% | 0.73% | 18 | 1.13 | 50.00% |
| 2016 | $6,990.00 | 18.33% | 11.37% | 31 | 2.93 | 61.29% |
| 2015 | $12,300.00 | 32.25% | 25.01% | 32 | 3.46 | 68.75% |
| 2014 | $6,760.00 | 17.72% | 15.93% | 35 | 2.64 | 62.86% |
| 2013 | ($80.00) | (0.21%) | (0.19%) | 10 | 0.93 | 50.00% |
| 2012 | ($235.00) | (0.62%) | (0.55%) | 16 | 0.91 | 56.25% |
| 2011 | $4,160.00 | 10.91% | 10.78% | 24 | 2.15 | 62.50% |
| 2010 | $445.00 | 1.17% | 1.17% | 10 | 1.42 | 50.00% |
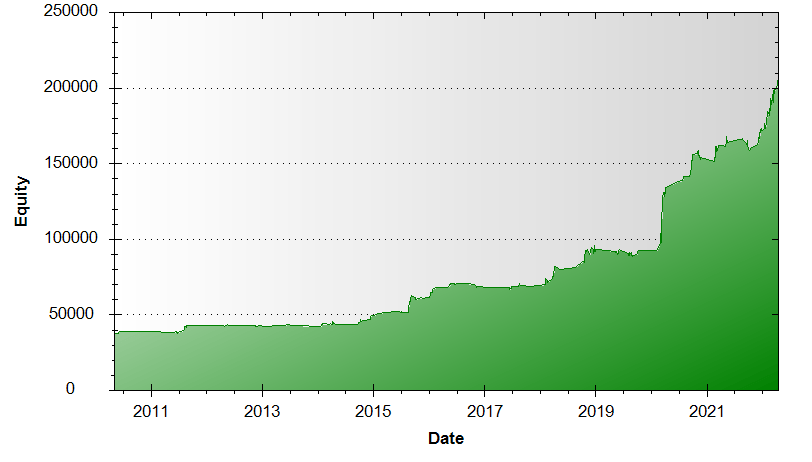
Capital Curve – Daily Equity
In this chart you can see the profit curve of this intraday trading strategy: QMSys_NQ1
Drawdown Curve
In this chart you can see the drawdown of this intraday trading strategy expressed in dollars: QMSys_NQ1

Other related products
QMSys_FLT3_NQ v1
Intraday system for Nasdaq futures, made by our Genetic Builder. A maximum of 4 contracts (Emini or micro) per buyer is allowed to protect liquidity.

QMSys_FLT3_NQ v2
Intraday system for the Nasdaq future, made by our Genetic Builder. A maximum of 4 contracts (Emini or micro) per buyer is allowed to protect liquidity.

QMSys_FLT4_NQ
Intraday system for the future of sp 500 and NQ, made by our Genetic Builder with the improvements of the new 2022 methodology.
Hypothetical performance results have many inherent limitations, some of which are described below.
No representation is being made that any account will or may make profits or losses similar to those shown. In fact, there are often large differences between hypothetical performance results and the actual results subsequently achieved by any particular trading strategy.
One of the limitations of hypothetical performance results is that they are generally prepared with the benefit of hindsight. In addition, counterfactual trading does not involve financial risk, and no counterfactual trading record can fully explain the impact of financial risk on actual trading.
For example, the ability to withstand losses or stick to a particular trading strategy despite trading losses are important points that can also adversely affect actual trading results. There are numerous other factors related to the markets in general or the implementation of any specific trading strategy that cannot be fully considered in the preparation of hypothetical performance results and all of which may adversely affect actual trading results.