

Volatility: ORB Intraday Strategy for ES
Here we present this code in Easylanguage , which can be useful when creating your own strategies, the article was translated by our work team.
Did that title catch your attention?
No, I have said that it is a very good free system! This code is really cool so I thought I’d share it with you. Take a look at this pretty cool image.

Six Bar Break Out with Volatility Buffer and Volatility Trailing Stop
Thanks to a reader of this blog (AG), I came up with this idea and programmed a very simple day trading system that incorporated a volatility trailing stop. I wanted to make sure I had programmed it correctly and always wanted to draw a box on the graph – thanks to (TJ) from the MC forums for giving me a boost on the graphical side of the project.
Since my time is up for today – I have to cut my hair. I’ll have to wait until tomorrow to explain the code. But very quickly the system.
Buy x% above the first bar high, then set a trailing stop z% of the average range of the y bar – move to breakeven when profit exceeds $w. The opposite goes for the short side. One long and one short is only allowed during the day and everyone’s departure at closing.
Who cares, here is the code of the Strategy:
And the code for the strategy monitoring indicator is the following:
It is very important to set the default values of the flags as well.
For the BO box use these settings – they are the first 4 plots:
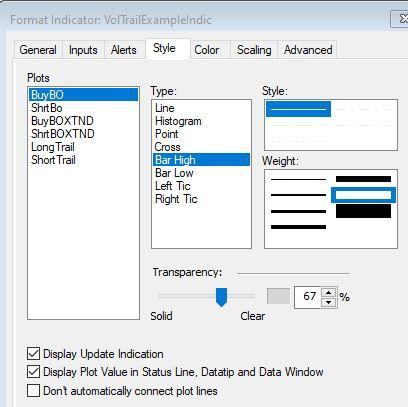
Use these colors and high bar and low bar and set the opacity
The box is created by drawing thick semi-transparent lines from BuyBo and BuyBOXTND to ShrtBo and ShrtBOXTND. So the Buy components of the first 4 traces should be Bar High and the Short components should be Bar Low.
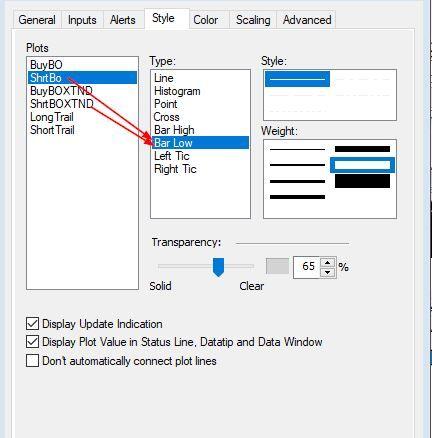
Use the low bar for the ShrtBo and ShrtBOXTND strokes
I have also used different colors for the BuyBo/ShrtBo and the BuyBOXTND/ShrtBOXTND. This is the configuration:
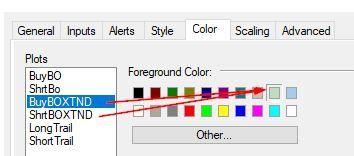
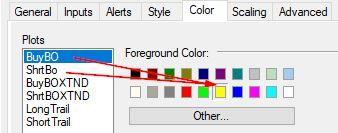
The darker colored line on the last bar of the breakout is caused by the overlap of the two sets of plots.
This is how the trailing stop plots are set up:

Make Dots And Make Them Big – We Have The Red And Blue Set
With this we end the article. We hope this information will be useful for you to build trading systems on the @ES based on volatility.
If you like the design of trading systems, we have available the “Forbidden Patterns Tool“, which uses this type of technique to define a pattern and then analyze all its possible permutations.
If you want more information and see a trial of this tool, click on the following link: Request a Trial.
Article courtesy and written by George Pruitt and published on his blog on April 1, 2021
Quantified Models Youtube Channel
On our YouTube channel we have several videos available that you may find very useful for developing trading systems. To access, click this link: Quantified Models YouTube Channel
We hope this information has been useful to you.